Mouse cell atlas
Paper published 2018-10-03The biological question
A piece of lung or liver contains many kinds of cells. If researchers measure all of their RNA together, the result blends distinct biological jobs into one average. Tabula Muris asked a more precise question: which genes are active in individual cells, and how do those patterns change across the organs of a mammal?
How the study worked
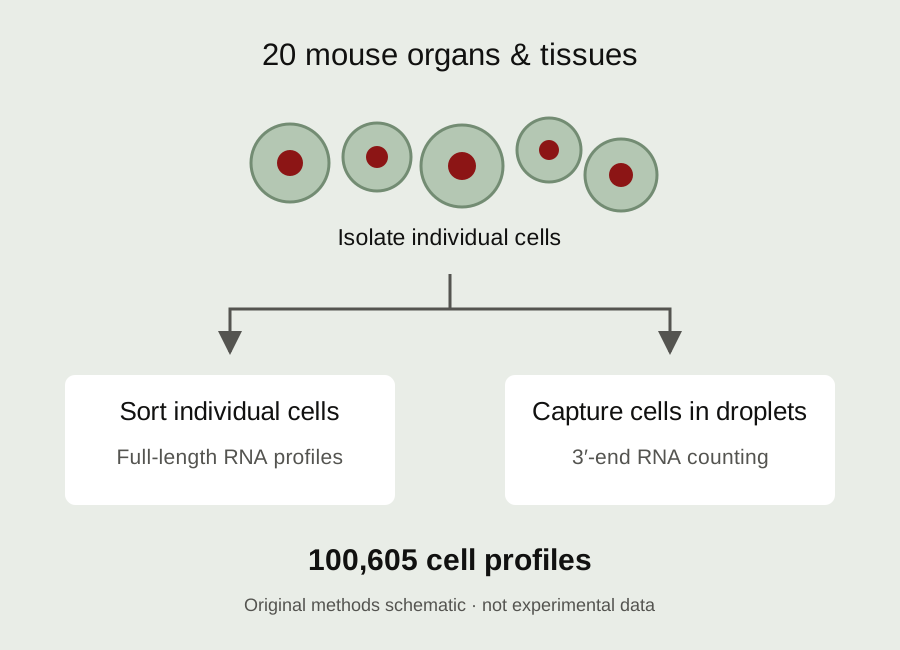
The Stanford and Chan Zuckerberg Biohub collaboration built a reference from 100,605 cells collected across 20 mouse organs and tissues. The animals were young adults, with three female and four male mice contributing samples. Collecting different tissues from the same animals helped researchers compare organs while controlling some of the differences that would arise if every tissue came from a separate experiment.
The team used two complementary ways to read cellular RNA. One sorted individual cells using fluorescence-activated cell sorting and measured transcripts with relatively high sensitivity. The other enclosed cells in tiny droplets, allowing many more cells to be surveyed efficiently. Comparing the approaches helped reveal where their measurements agreed and where a method might capture a different view of the tissue.
What the atlas revealed
Cells with similar expression patterns could then be grouped and annotated. That made it possible to examine familiar populations, including immune cells and the endothelial cells that line blood vessels, across several anatomical locations. The reference showed how cells can share a broad identity while also expressing genes associated with their particular tissue environment. It also supplied information about populations that had been harder to characterize in earlier experiments.
The result is useful as a starting point for new questions. A researcher studying a gene can ask which cell types express it, then design experiments to investigate its role. Someone comparing healthy and diseased tissue can use the atlas as context for interpreting a change in cell composition or gene expression.
What it cannot tell us
The limits matter. These measurements describe RNA in sampled mouse cells at one stage of life. RNA abundance does not by itself establish protein activity or prove what a gene does. Preparing tissues as separate cells also loses their original spatial arrangement and can favor cells that survive the preparation. The atlas therefore supports hypotheses rather than replacing functional experiments. Its lasting contribution is an openly shared, cell-by-cell reference that other researchers can question, compare and extend.
Key terms
- Transcriptome
- The RNA molecules expressed by a cell.
- Single-cell RNA sequencing
- Measuring gene expression in individual cells.
- Endothelial cell
- A cell lining blood vessels.
Original publication
The Tabula Muris Consortium. Single-cell transcriptomics of 20 mouse organs creates a Tabula Muris. Nature 562, 367–372 (2018).
Published online October 3, 2018.
Read the paper · DOI 10.1038/s41586-018-0590-4 ↗Read the full manuscript ↗
Sources reviewed & Stanford connection
Primary paper and public manuscript reviewed.
The Tabula Muris collaboration includes Stanford and Chan Zuckerberg Biohub researchers.
This is an original explanatory article about the cited study. It is not a new paper or Stanford-authored news report.